Bring your brewlytics data into focus.At mission scale.
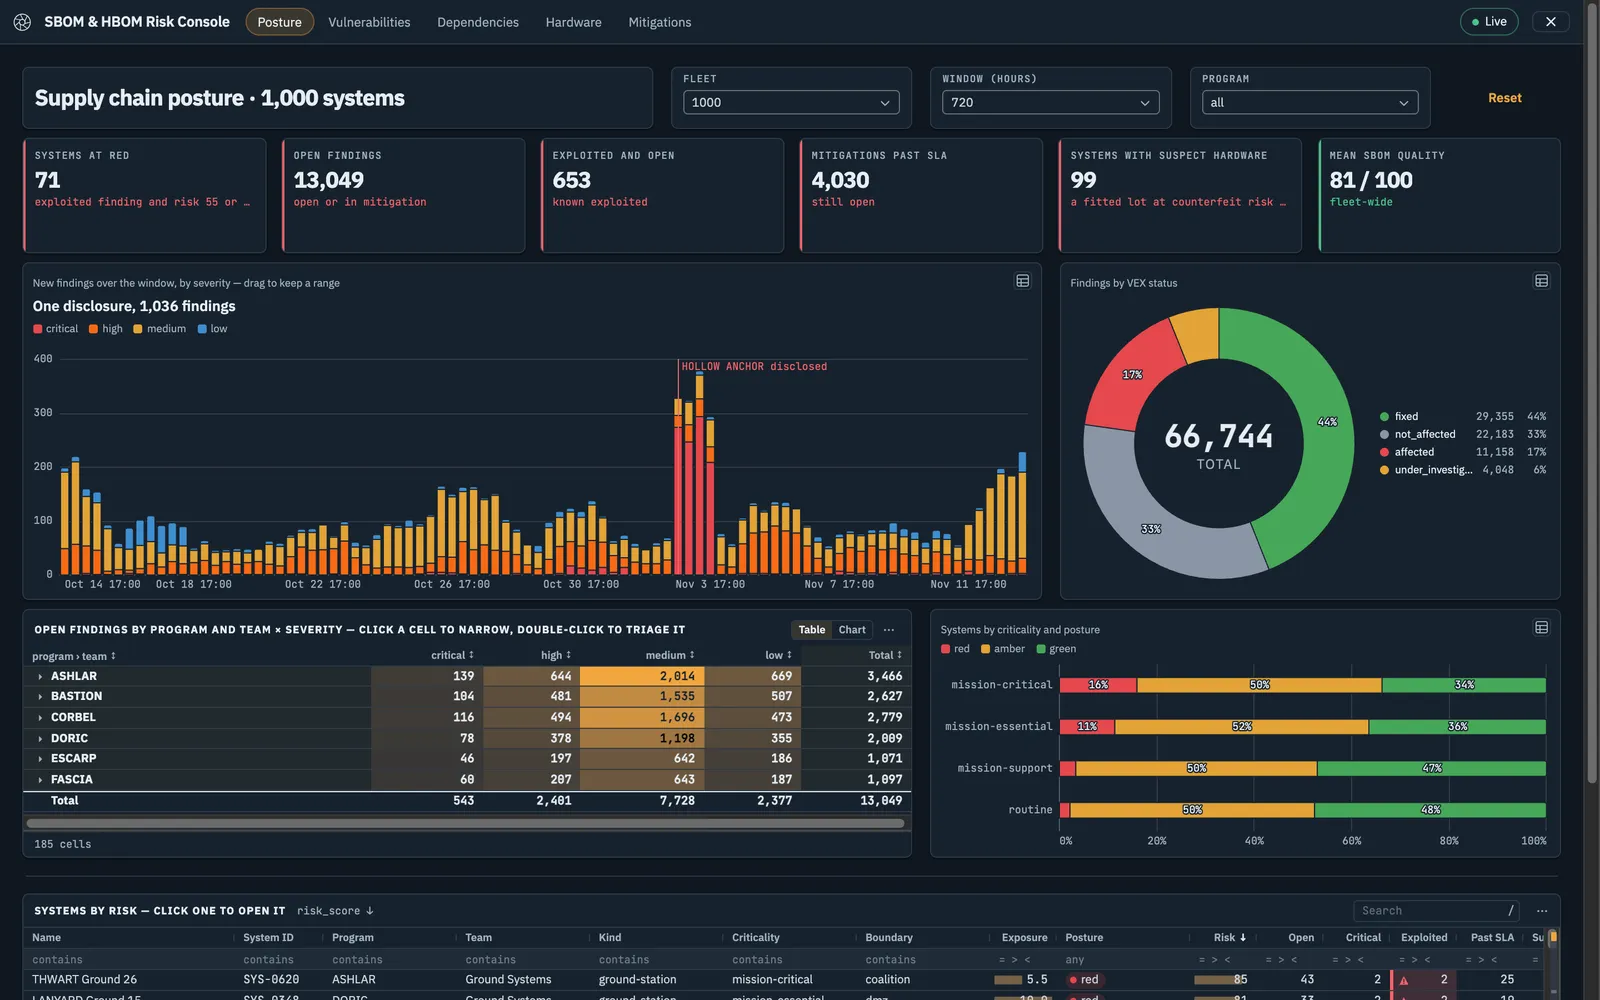
A model run that ends in a table is a blur of rows. brewlens is the lens: it turns your models' outputs into the application your operators work in — a million detections on a map and a spectrum, a million-edge graph — and every view stays sharp, because the data never leaves the server.
Every new question waits on another hand-built view
With brewlens, the model becomes the app
Bind any model output to a map, chart, graph, or table
Controls on the page drive the next model run
Multi-page, themed, and interactive
The mission just opens it
Open a link — no builder, no model knowledge
The same sign-in as brewlytics
Shared with people and groups by role
How it goes
From model to mission app in three steps
01
Start
Start from a mission template
brewlens comes with working multi-page apps to copy: software and hardware supply chain risk, signals detections, security operations triage, threat hunting, a common operational picture, collection management, and readiness and sustainment.
Every template runs on demonstration data the moment you open it
Or start blank and drag components onto the canvas
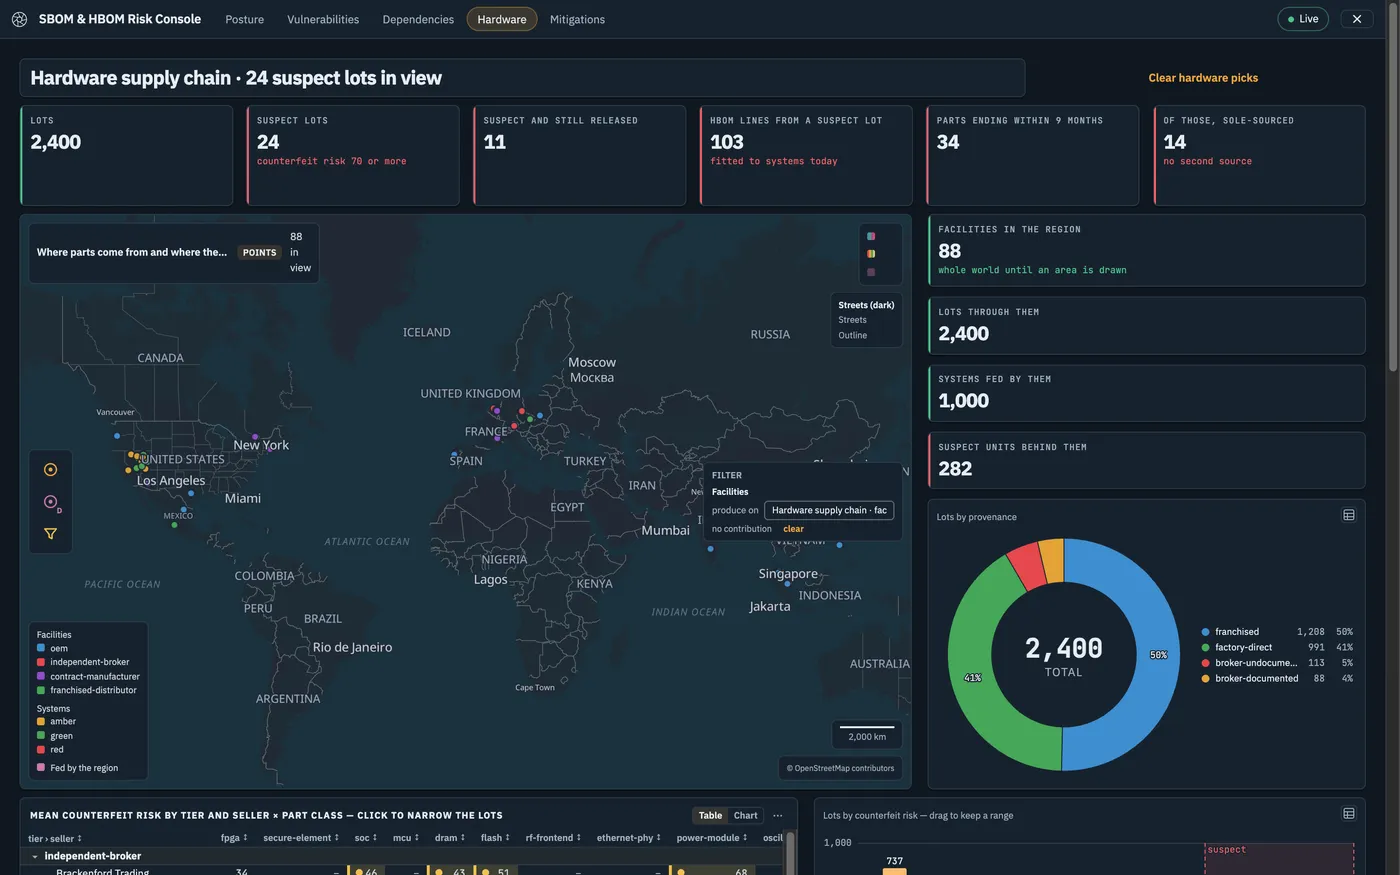
SBOM & HBOM Risk Console · Hardware
02
Connect
Point it at your model and make it yours
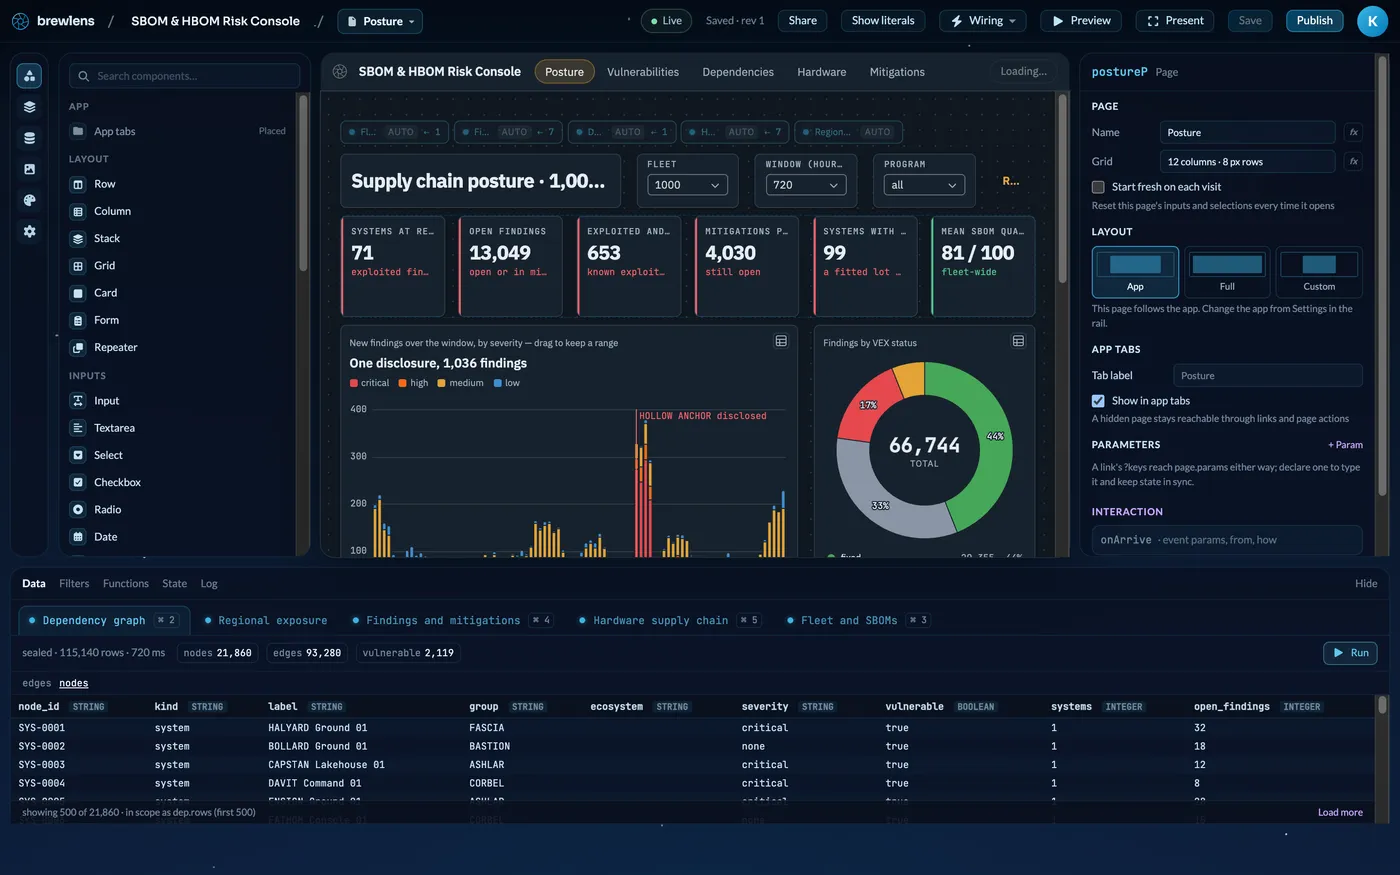
Swap the demonstration query for a brewlytics model or a brewDB source. Its outputs feed the components; the selects, date ranges, and drawn areas on the page become its inputs. Then rearrange, add a drill-down, and pick a theme.
Runs on load, on a timer, on demand, or whenever an input changes
Counts and sums are computed over the whole result, not a preview
Click a bar or brush a range and the whole page filters with it
Builder · SBOM & HBOM Risk Console
03
Publish
Put it in front of the mission
Preview runs the app as an operator will see it. Present puts it full-screen on the wall. Publish gives it a link of its own, with the builder gone.
Viewer, Editor, and Owner roles for people and groups
A classification banner follows your site configuration
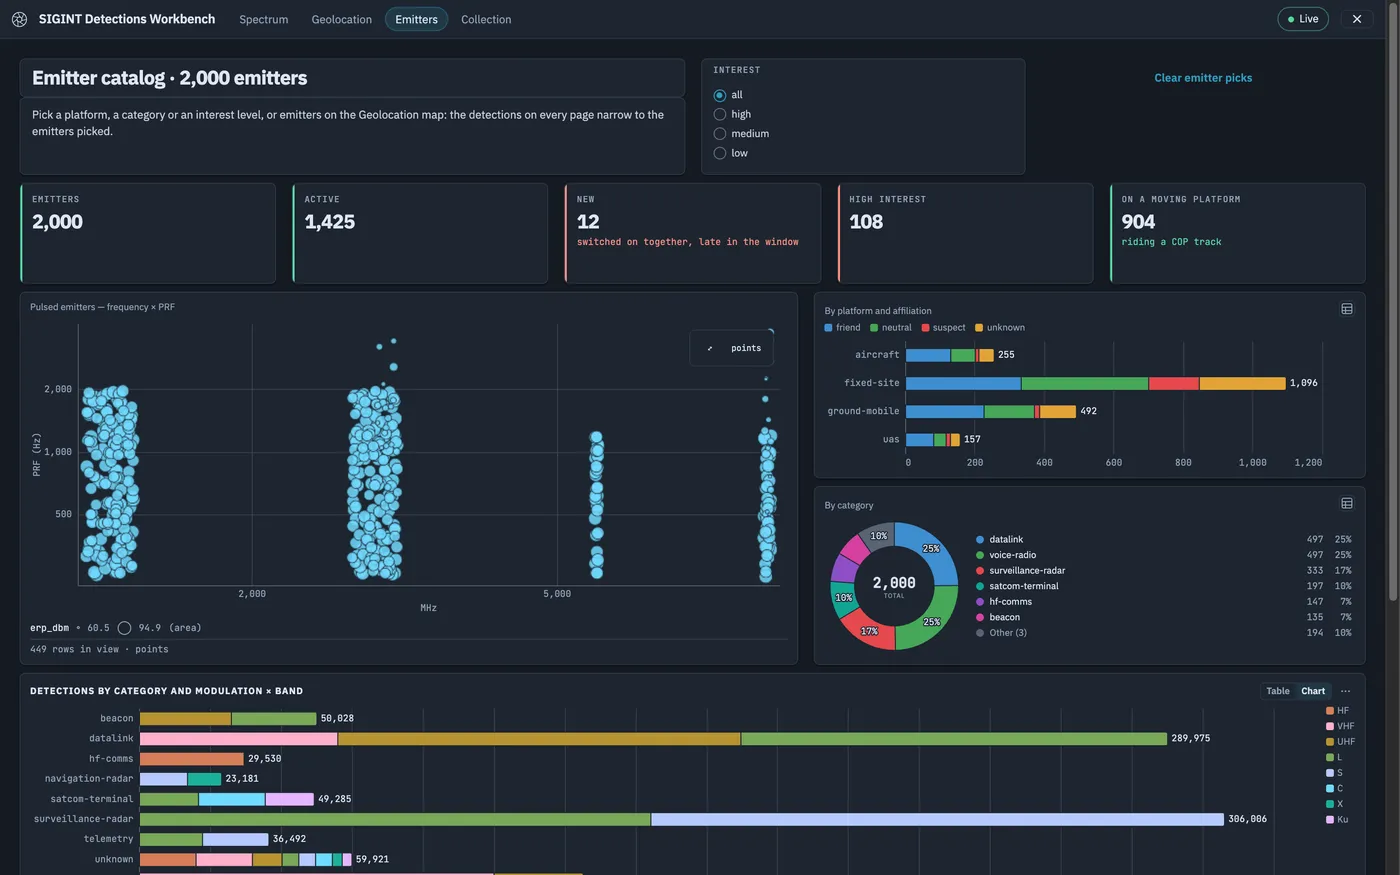
SIGINT Detections Workbench · Emitters
Built for scale
Other app builders fetch the dataset. brewlens never sends it.
Most builders pull rows into the browser and draw what fits. brewlens keeps every result in its data core and answers each component with exactly the slice it draws, so the size of the answer follows the screen, not the dataset — and the picture stays in focus however far you zoom out.
600,000 map positions answered as density, with an exact count
0.48 s
sent to the browser for that map — the same data as points is 2.4 MB
7.5 KB
to bin a one-million-row scatter plot on the server
< 140 ms
laid out and clustered by the data core in about five seconds
1M edges
Measured in brewlens engineering test runs on demonstration data, on a single workstation. Your data and hardware will differ.
The map
A million detections on one map
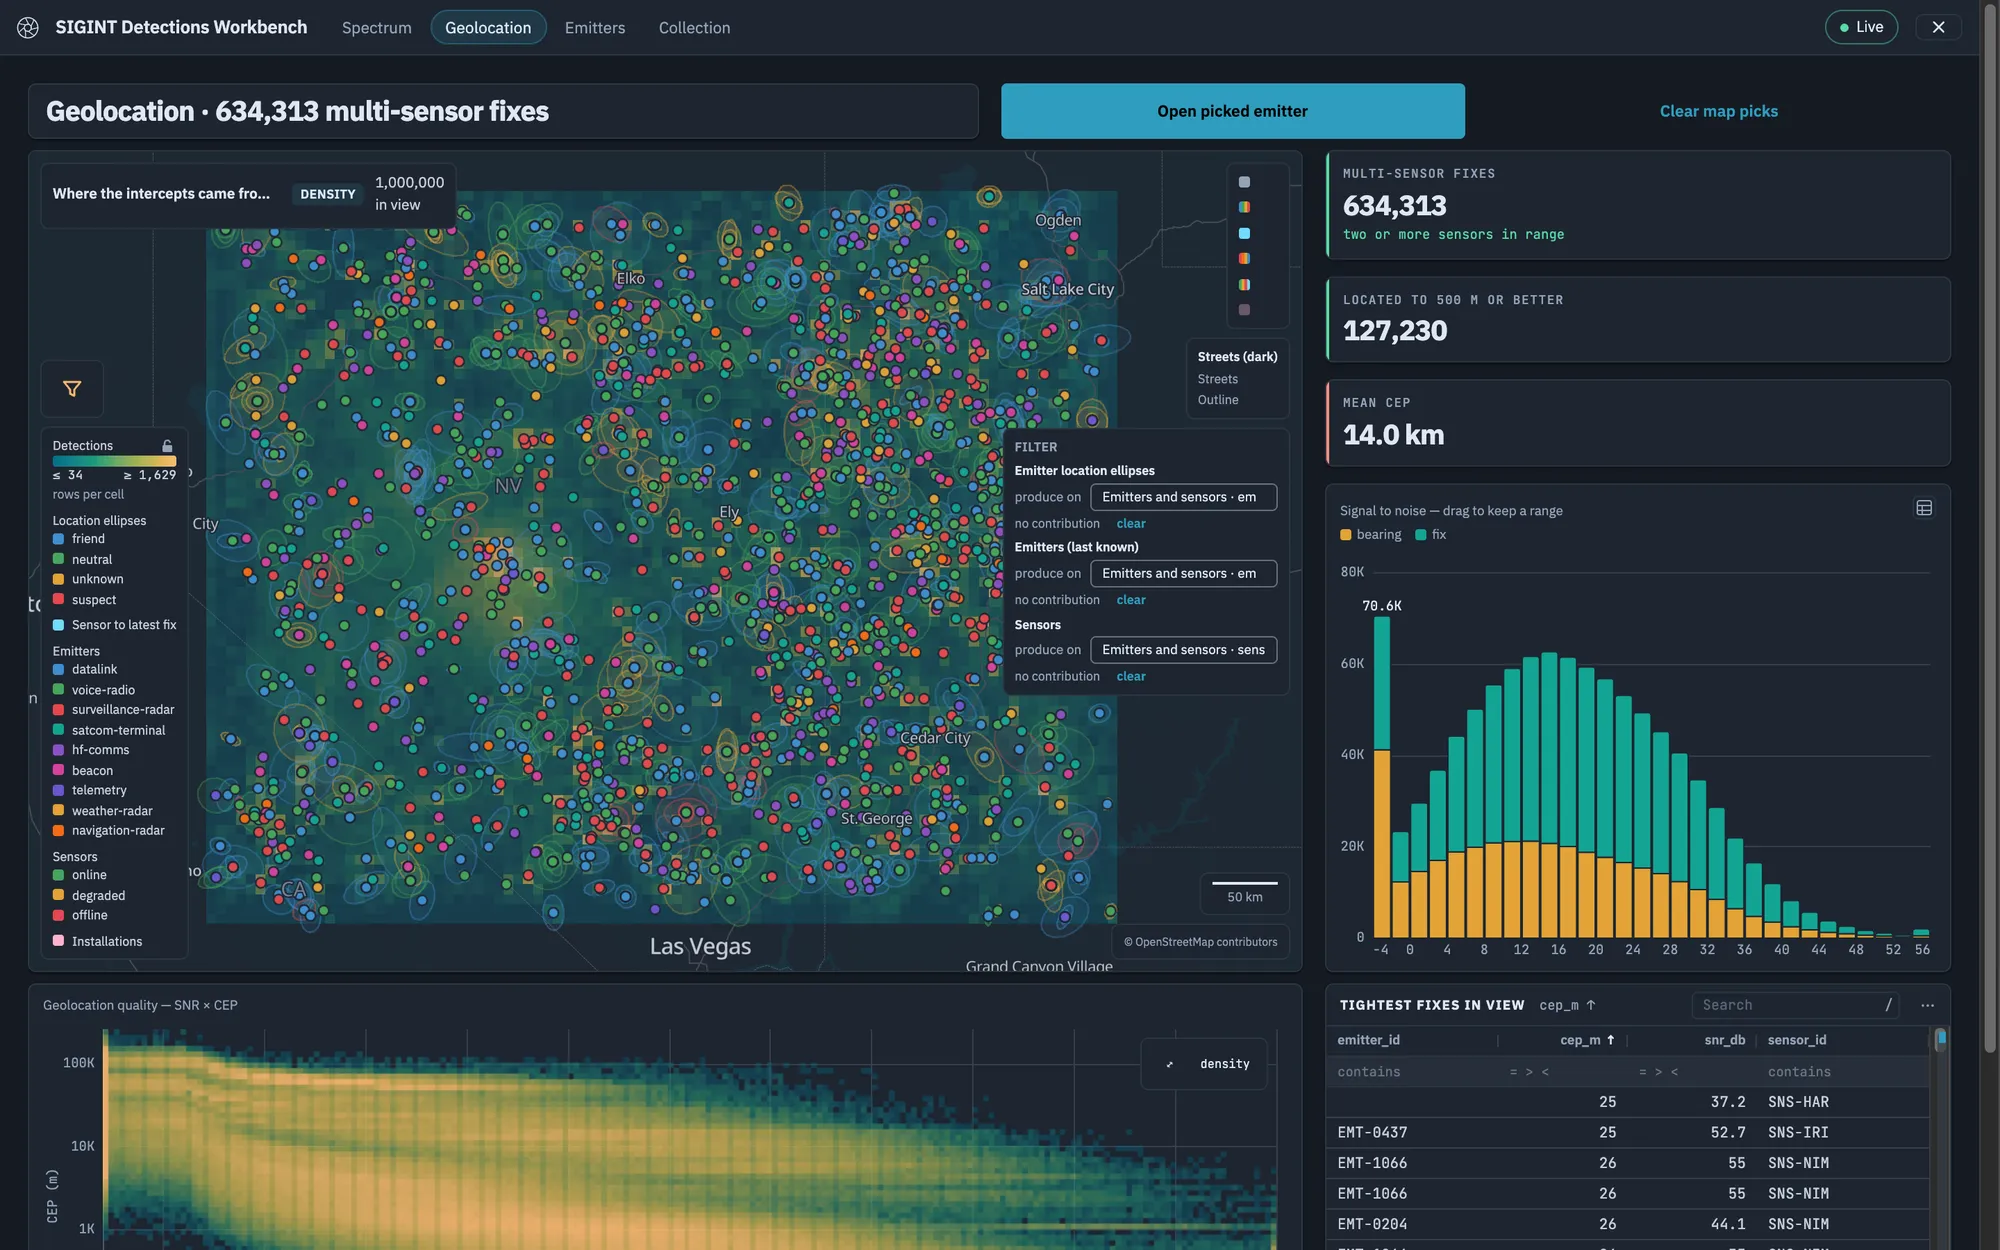
Zoomed out, the data core answers with density cells and an exact count. Zoom in and the same layer resolves into individual points, lines, and polygons you can click. The answer is sized to the screen, so the map stays responsive as the dataset grows.
600,000 positions returned as 1,740 density cells in under half a second
Density, points, and error ellipses layered on one map
Draw an area on the map to filter the page or feed a model input
SIGINT Detections Workbench · Geolocation
The charts
Charts that count every row
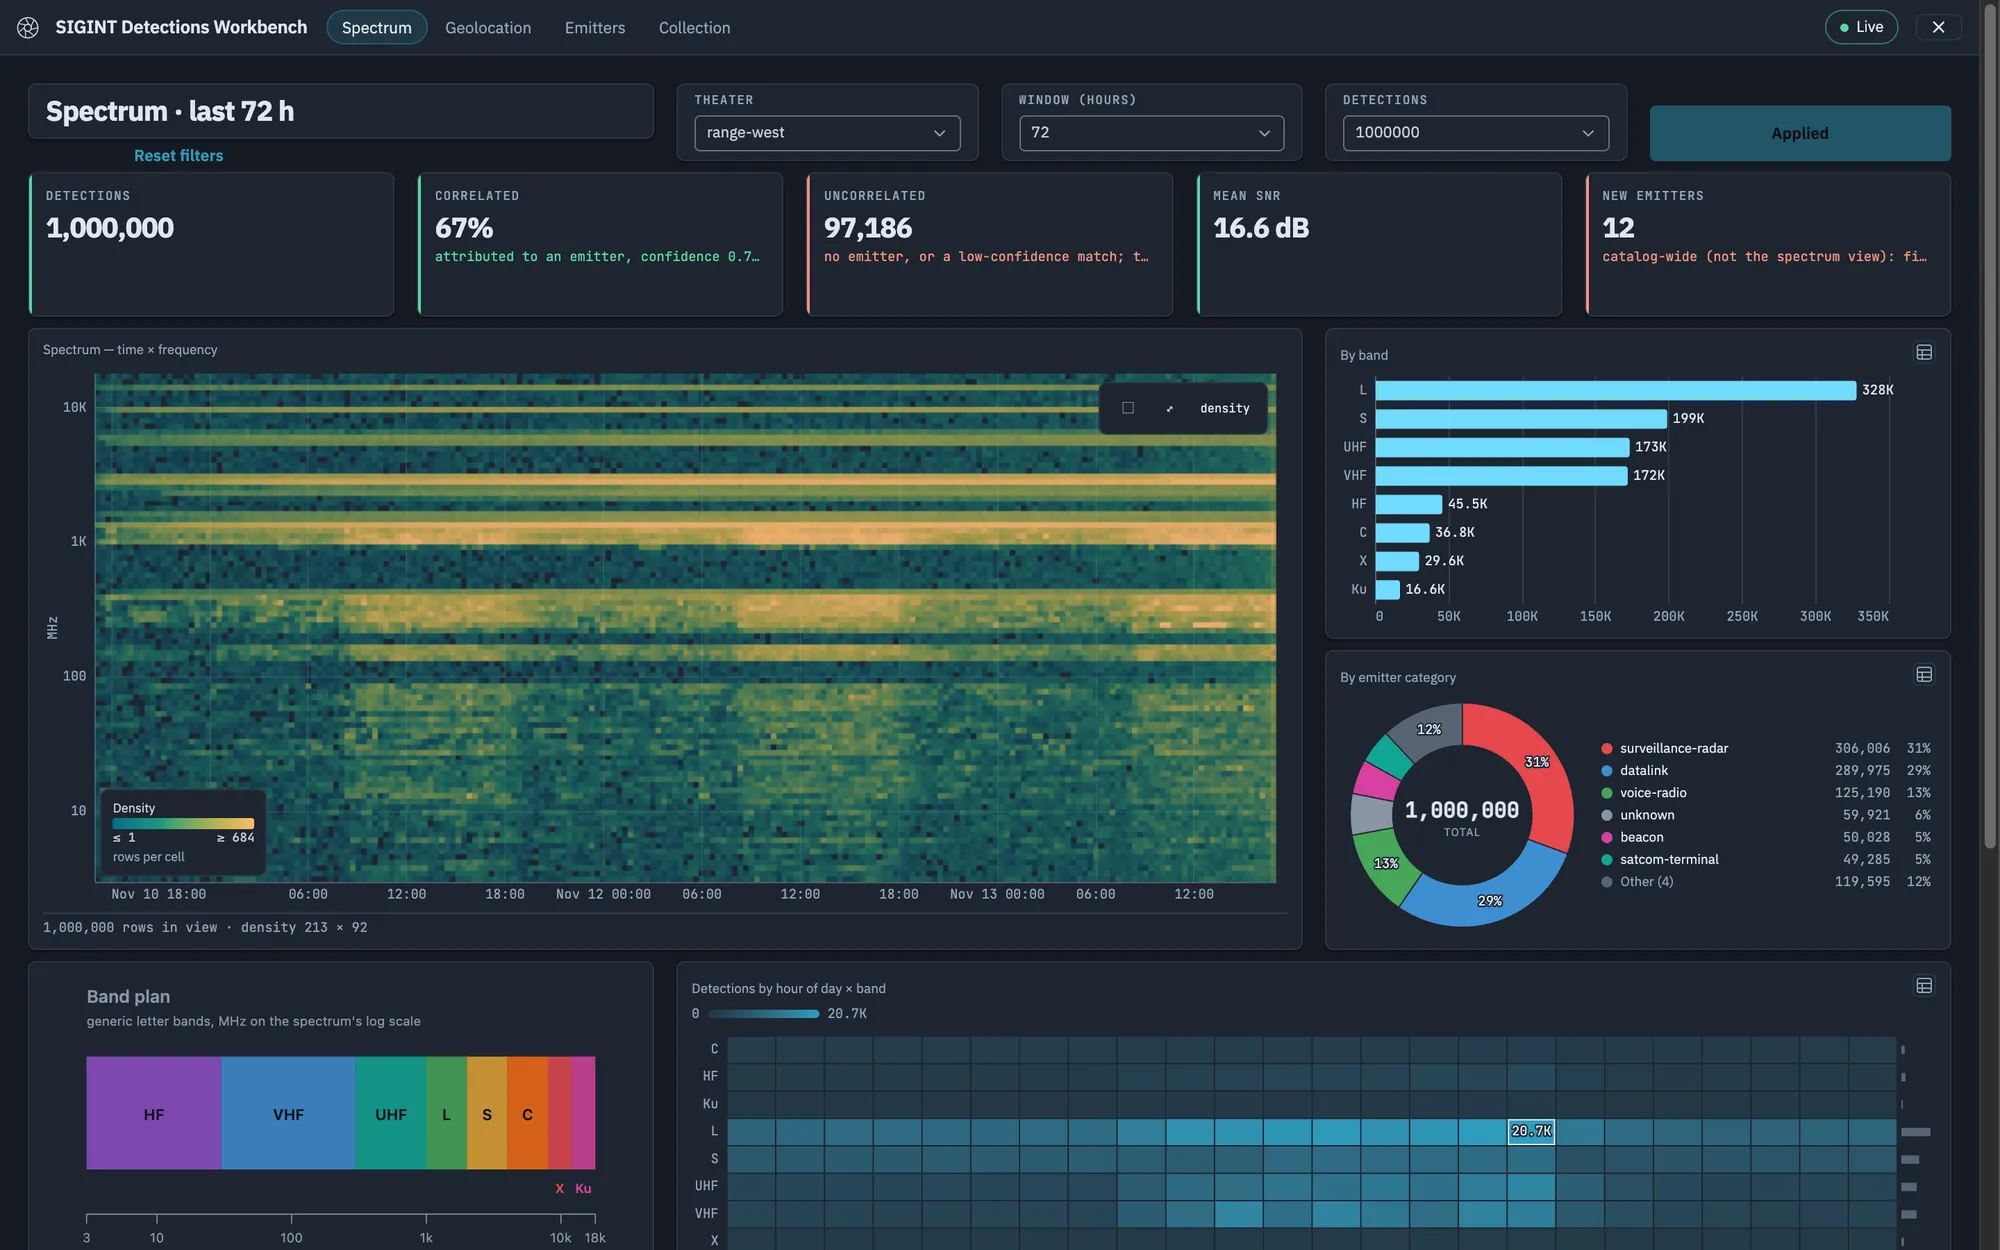
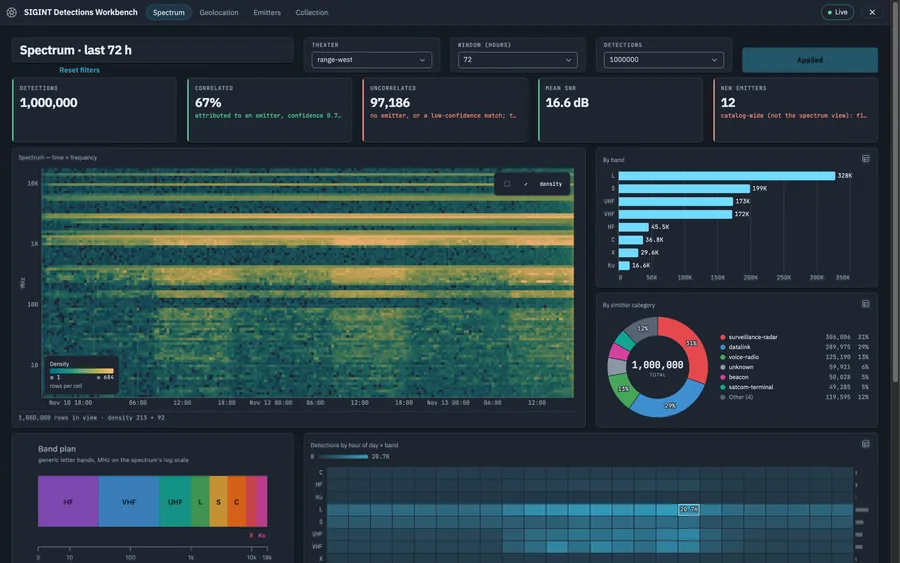
Columns, bars, lines, areas, donuts, heat maps, histograms, dot plots, scatter plots, and pivot tables. Each one is an aggregate over the entire result, computed where the data lives — never a sample of whatever reached the browser.
A million-point scatter draws as density in well under a second
Brush a range or click a mark to filter every component on the page
Tables page through the whole result and say how many rows there are
SIGINT Detections Workbench · Spectrum
The network graph
Graphs past the point where browsers give up
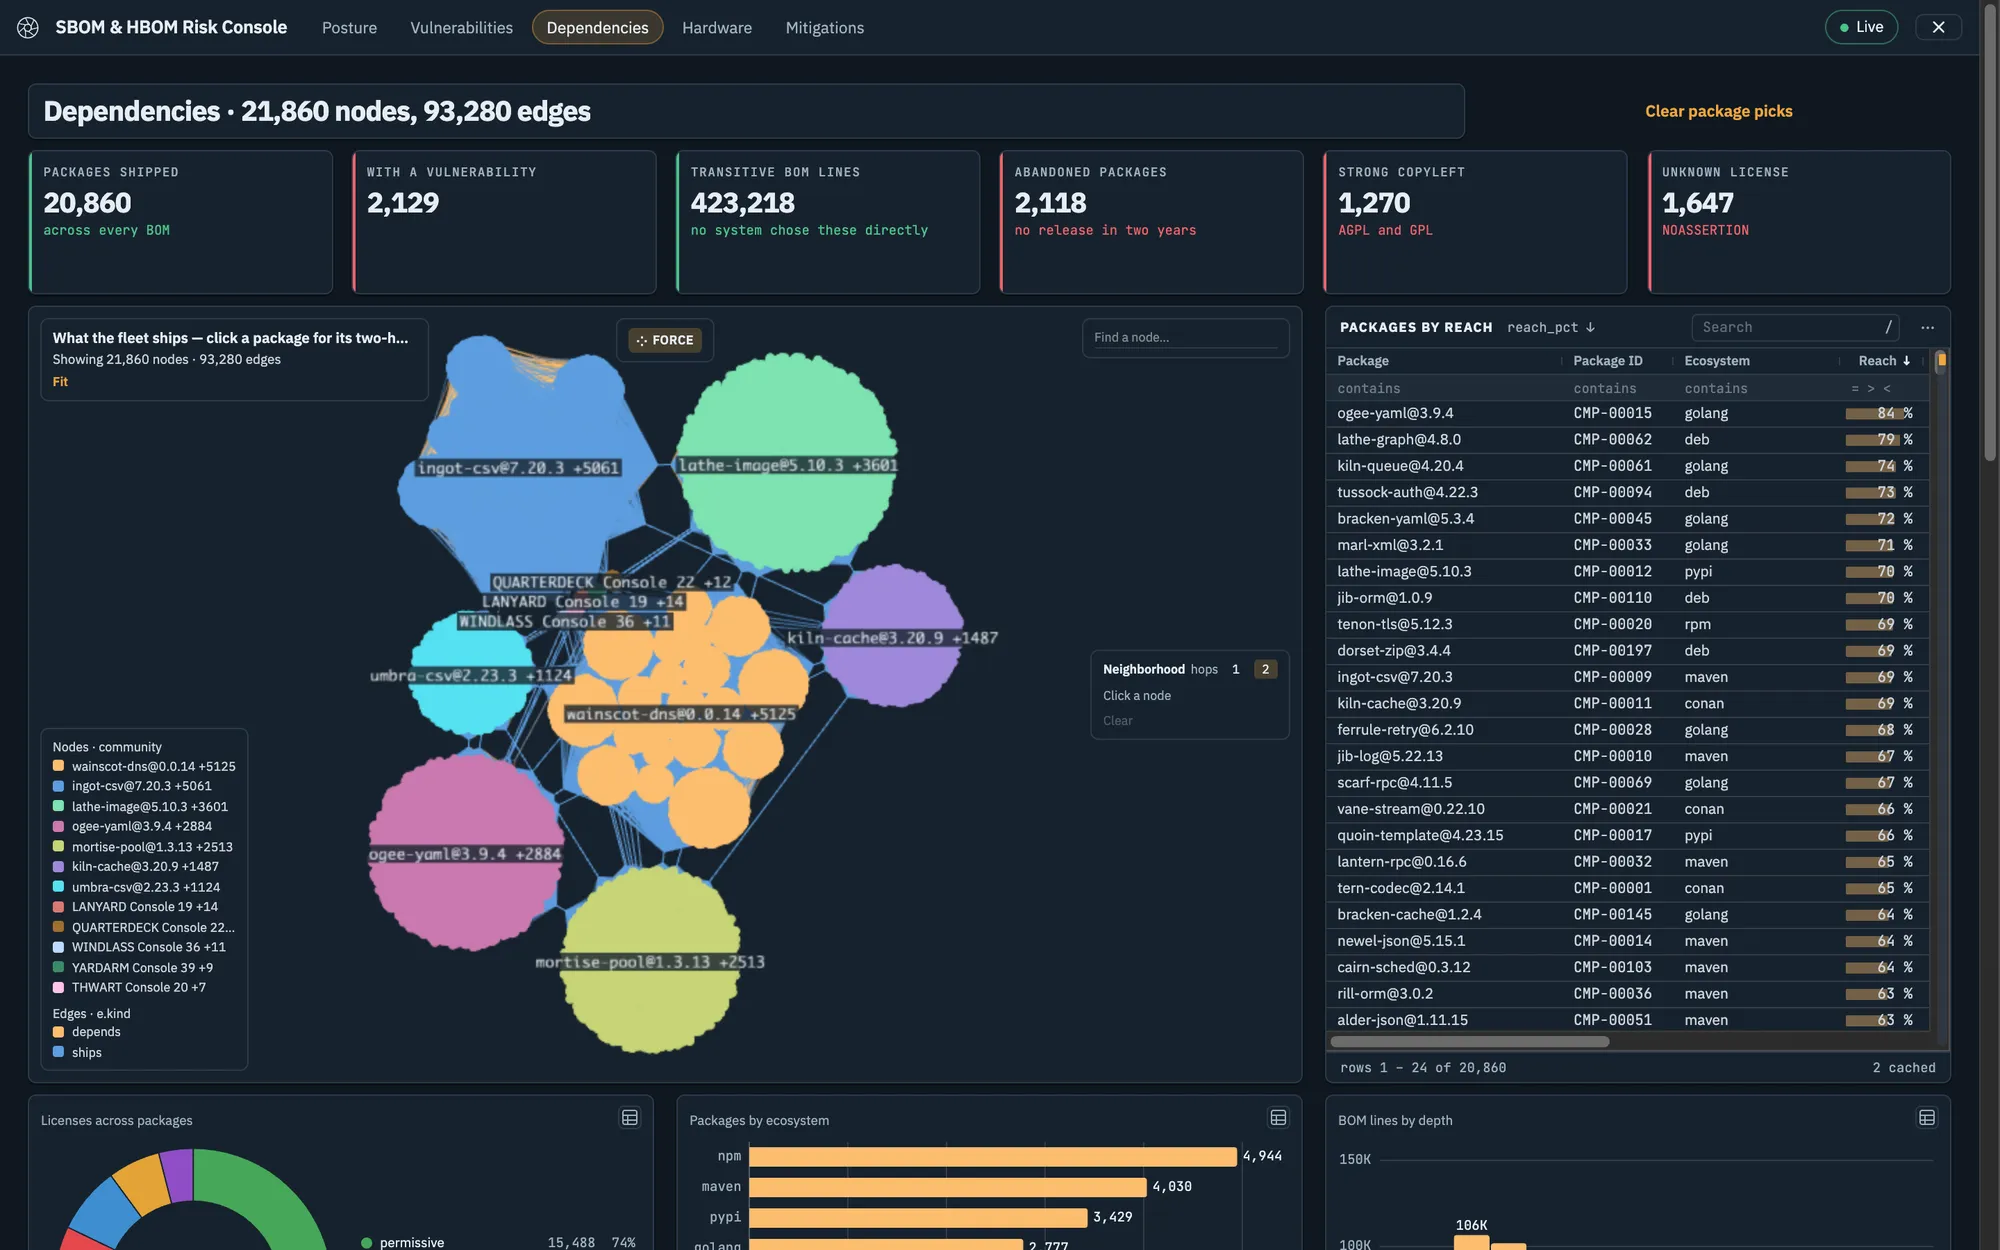
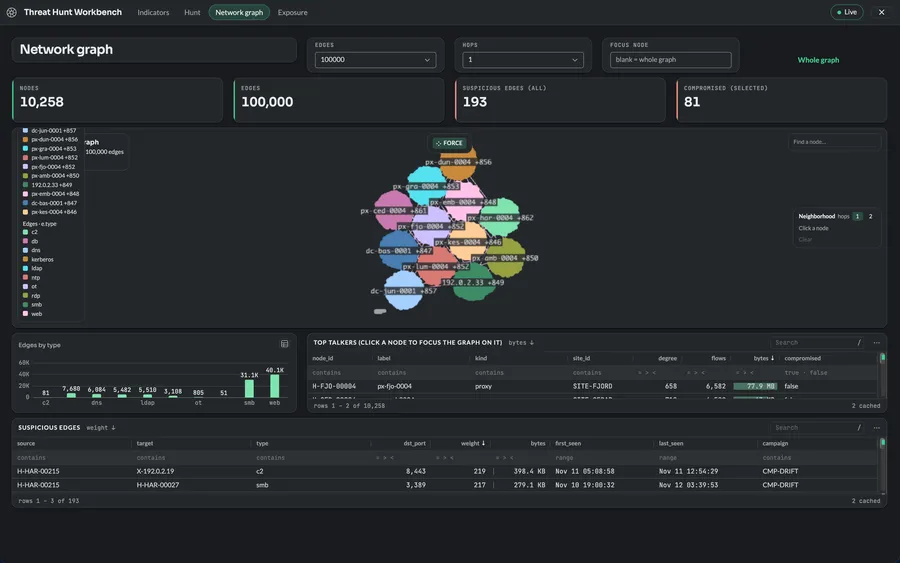
Layout and community detection run in the data core, not in the tab. The browser receives finished positions and draws them, so a graph too large to lay out locally still arrives as a picture you can read.
A one-million-edge graph laid out and clustered in about five seconds
A 100,000-edge graph ready in about a second and drawn at 60 frames a second
Up to 500,000 edges drawn whole; pick a node to pull just its neighbourhood
SBOM & HBOM Risk Console · Dependencies
Mission templates
Start from an app that already works
Each template is a complete multi-page application on demonstration data. Copy one, point it at your model, and make it yours.
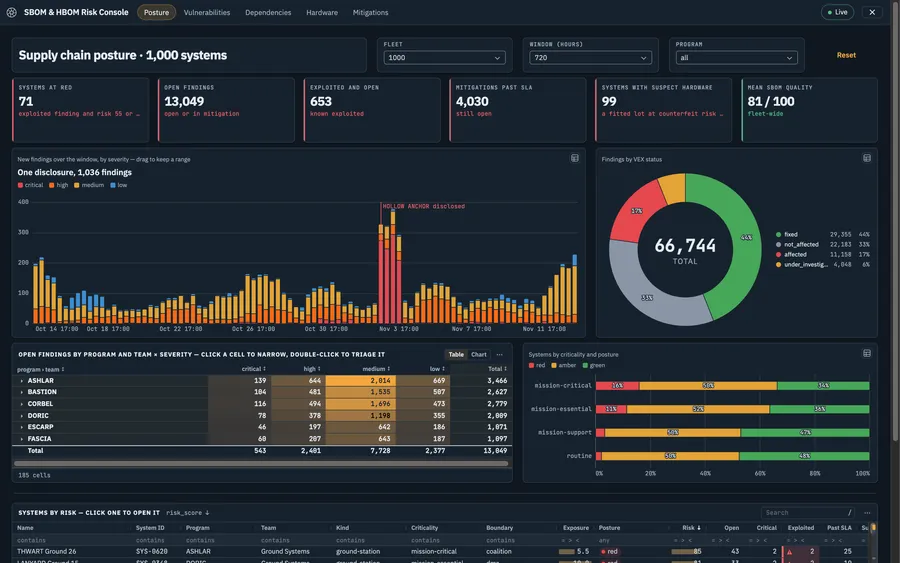
SBOM & HBOM Risk Console
Findings and triage, the blast radius of one library, a dependency graph, and a hardware supply chain map.
SIGINT Detections Workbench
A million intercepts on a time × frequency spectrum, geolocated with error ellipses, and an emitter catalog.
Threat Hunt Workbench
Indicators by feed and campaign, a per-indicator hunt page, and a network graph of up to a million edges.
Also included: Common Operational Picture · SOC Triage Console · ISR Collection Manager · Readiness & Sustainment · SBOM Intake.
New to the platform? See how a workflow is built on the brewlytics canvas, or where the data lives in brewDB.
 brewlens